July’s ONS youth unemployment data is filled with youth employability challenges, says our CEO Laura-Jane Rawlings. Young furloughed workers have grey employment status, not all eligible young people are claiming Universal Credit, and without it they can’t access investments like the KickStart Scheme…
The Office for National Statistics (ONS) releases data each month called the Labour Market Overview (you can access it here.) The overview estimates the rates of employment, unemployment, economic inactivity and the number of people within the categories, alongside other employment-related statistics for the UK.
The overview draws on information from the Labour Force Survey (LFS); a survey of households and businesses. It is not practical to survey every household each quarter, so these statistics are estimates based on a large sample. Other surveys and dataset supplement the LFS.
Headlines March-May 2020: 16-24 year olds
- There are currently 6,878,000 young people in the labour market
- Unemployed: there are 540,000, an increase of 26,000 from the previous quarter and 47,000 from the last year. The unemployment rate is 18.1%, an increase of 3.9% from the last year.
- Economically inactive: 2,553,000, up from 2,544,000 last quarter and from 2,654,000 a year earlier. 693,000 of which are not in full time education.
- NEET: 1,000,042 (economically inactive plus unemployed)
- Claimant Count: 516,800 young people*.
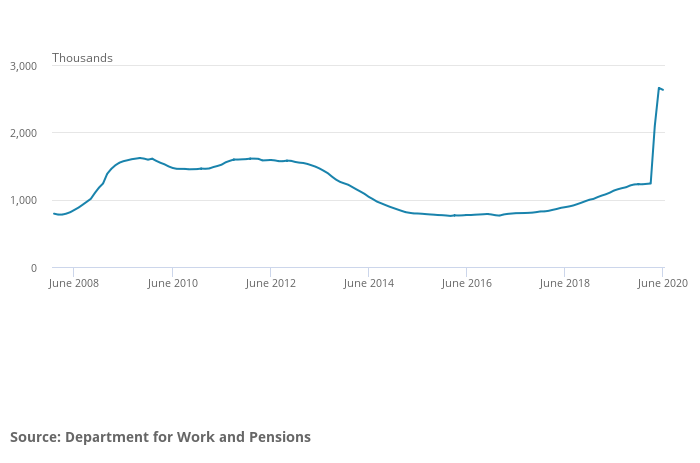
Total claimant count stands at 2,630,800, a 112.2% or 1.4 million increase since March 2020.
This figure has been produced using experimental data.
Our views
Today’s picture does not yet tell the full story of the impact of Covid-19 on youth unemployment. There are also additional complexities with the data and the challenge that still lies ahead as lockdown slowly eases.
Young furloughed workers have grey area employment status
One of those challenges is the protection and ultimate wind-down of the Coronavirus Job Retention Scheme (CJRS). Many people have been furloughed and have temporarily stopped working. This has placed people’s employment status into a grey area, and left them facing uncertainty about their futures.
Not all young people who are eligible are claiming Universal Credit
We know that not all young people who are unemployed and looking for work will claim Universal Credit. In our Youth Voice Census 2020 only 10% of those young people who spent time NEET applied for Universal Credit, increasing to 29% for those with additional needs. Young people also told us that they do not know about the welfare services available to them, with 77% of young people never having been told about the support that is available. Young people also told us that they believe there is still a stigma to claiming support or that they can rely on family or the hope that they will find work quickly.
The challenge with young people not claiming Universal Credit is that they are not counted in the claimant numbers which indicate levels of unemployment but also they are unable to access some of the support that is available, including some of the new schemes announced by the Chancellor.
Young people not claiming UC can’t access a range of employment and support schemes
The KickStart Scheme, traineeship, sector-based work academy and increased number of work coaches are good investments from the government but will only be available to universal credit claimants. There is a real risk that young people will fall through the gaps in this developing landscape, including and most importantly young people who face multiple barriers to work and need the benefit of these support packages the most.
What are the challenges with the way this data is captured?
Varying definitions can skew the data
One particular challenge with this dataset is the definitions behind each cohort. The LFS uses the International Labour Organisation (ILO) definition of employment. This is a very refined definition – it includes those who are in work during the reference period and those who are temporarily away from a job. This would skew the data to include those receiving support through the coronavirus Job Retention Scheme (CJRS) and Self-employment Income Support Scheme (SEISS). There is a strong chance that not all of the 11,600,000 people on these schemes will have a job or business to return to.
Not all people claiming are out of work
The ‘extent of unemployment’ is another point mentioned in the labour market overview. As people see their income drop through job losses and 80% pay on the income support schemes, the number of people receiving Universal Credit ‘unemployment related benefits’ has increased. This affects the claimant count as not all people claiming are out of work, some are just topping up their income. The Department for Work and Pensions (DWP) this morning has released experimental data that looks to address this but it has its limitations.
The Data
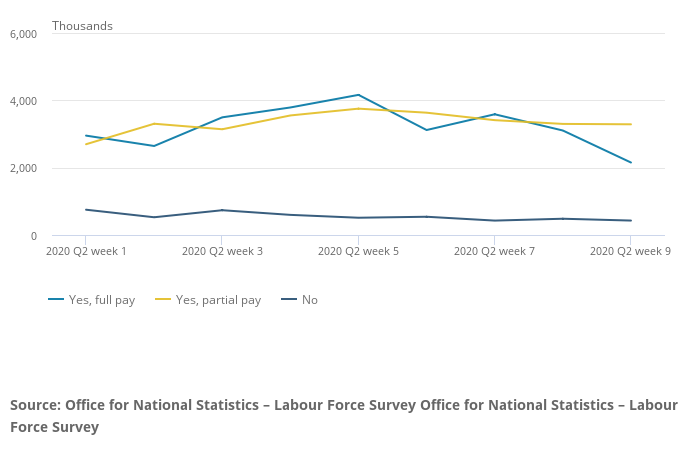
 Figure 4: The total number of persons receiving full, partial or no pay while their job is on hold and affected by the Covid-19 pandemic, not seasonally adjusted, UK, April to May 2020.
Approximately half a million employees are temporarily away from their jobs specifically for coronavirus-related reasons and were receiving no pay while their job was on hold. This experimental weekly LFS estimate suggests that during May 2020 around 450,000 to 500,000 employees, who identified themselves as being temporarily away from their jobs because of the coronavirus (COVID-19) pandemic, were receiving no pay.
 Figure 8: UK Claimant Count, seasonally adjusted, between January 2008 and June 2020.
Between May 2020 and June 2020, the Claimant Count decreased by 28,100 (1.1%) to 2.6 million (Figure 8). Since March 2020, the claimant count has increased by 112.2%, or 1.4 million.

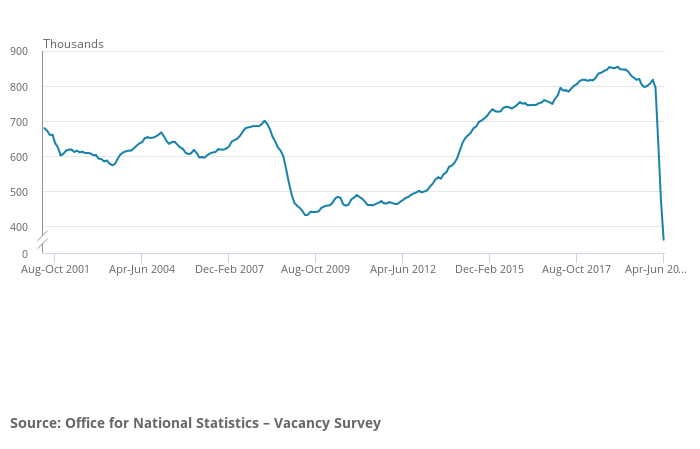
Figure 9: Number of vacancies in the UK seasonally adjusted, between April to June 2001 and April to June 2020.
April to June 2020 saw the lowest level of vacancies since the current data time series started in April to June 2001.For April to June 2020, there were an estimated 333,000 vacancies in the UK, the lowest level since the Vacancy Survey began in April to June 2001. This is 497,000 (59.9%) fewer than a year earlier and 463,000 (58.1%) fewer than the three months to March 2020. These are the largest annual and quarterly falls in the history of the data time series.


