The ONS have released the latest Labour Market Overview covering the months July 2021 – September 2021, there is additional data that covers October.
What Does This Mean For Youth Employment?
Headlines for young people
This data explores what this looks like for young people (16-24 years old).
In work:
The employment rate is 53%, up 1.3 percentage points (ppts) on the previous quarter, down 2.5 ppts since February 2020 (pre-pandemic).
- There are 3.6 million in employment, up 90,000 on the quarter, but still down 220,000 since February 2020.
- PAYE real time data shows that between October 2020 – 2021, 500,000 of the increase in payrolled employees are aged younger than 25 years.
- 13.4% of all part-time workers are aged 16-24 years old – this has returned to similar levels seen pre-pandemic.
Unemployment
The unemployment rate is 11.7%, down 1.4 ppt on the previous quarter, unchanged since February 2020.
- 475,000 are unemployed; down 55,000 on the previous quarter and down 30,000, since February 2020.
- 79.8% of those are aged 18-24, 20.2% are aged 16-17 years old.
- Of those unemployed:
- 310,000 have been so for up to six months, down 15,000 on the previous quarter and down 40,000 on pre-pandemic levels.
- 80,000 have been so for between six and twelve months, down 30,000 on the previous quarter and largely unchanged on pre-pandemic levels.
- 85,000 have been so for over 12 months, down 15.000 on the quarter, but up 15,000 on pre-pandemic levels.
- 20,000 have been so for more than 24 months, a fall of 10,000 on the quarter and a fall of 5,000 on the year.
- The claimant count in October 2021 stands at 350,000; this is a decrease of 11,000 on the month (-2.9%).
Economically inactive
The economic inactivity rate for young people is 40%, down 0.5 ppts on the previous quarter and up 2.8 ppt since February 2020.
- There are 2.7 million economically inactive young people; down 40,000 on the previous quarter, up 160,000 since February 2020.
- Estimates for young people not in employment, full-time education, and training (NEET) stand at 880,000, up 30,000 on the quarter and down 95,000 since March 2020.
Headlines for all ages
In work
The employment rate is 75.4%, an increase of 0.4 ppts on the previous quarter, but 1.1 ppts lower than before the pandemic.
- There are 32.5 million people in employment, up by 250,000 on the previous quarter, but down by 550,000 since March 2020.
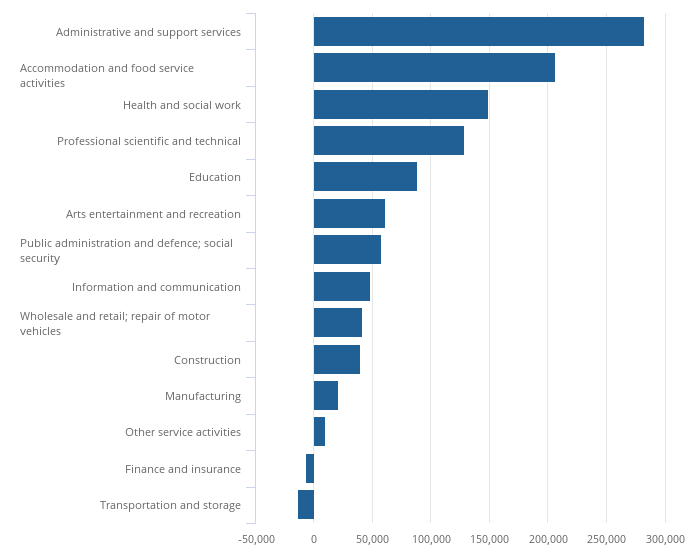
PAYE data shows 29.3 million are in paid employment, up 160,000 (or 0.6%) on the quarter, and by 1.14 million (or 4%) over the previous 12 months. See bar chart 1 for the disparities across different sectors.
- All regions except London are now above pre-coronavirus levels.. However growth has not been even throughout the regions; the number of payrolled employees in the UK per region ranges from 768,000 in Northern Ireland to 4,132,000 in the South East in October 2021.
- ‘Wholesale and retail’, ‘Health and social work’ and ‘Education’ (the three largest sectors in the UK) account for 40% of the UK employees. Administrative and support services, manufacturing, professional, scientific and technical, and accommodation and food service activities account for a further 30%.
Total actual weekly hours worked in the UK increased by 25.2 million hours from the previous quarter, to 1.03 billion hours (across July – September). However, this is still 25.6 million hours below pre-pandemic levels (March 2020).
The redundancy rate is 3.7 per thousand, an increase of by 0.2 per thousand on the quarter. At its peak in September to November 2020, the redundancy rate stood at 14.4 per thousand.
Bar chart 1 – Payrolled employees by sector changed between October 2020 – 2021. Source: HM Revenue and Customs – Pay As You Earn Real Time Information.
Unemployment
The unemployment rate is 4.3%, 0.5 ppts lower than the previous quarter, 0.3 ppts higher than before the pandemic.
- 1.45 million people are unemployed, a fall of 150,000 on the quarter but up 84,000 since March 2020.
- The fall in unemployment is being driven by a rise in part-time workers and those on zero-hour contracts, the majority of the latter are young people.
The claimant count stands at 2.1 million, a decrease of 15,000 (-0.7%) on the previous month.
The number of job vacancies in October 2021 was just short of 1.2 million, a new record high. Up 220,000 (or 23.4%) on the quarter.
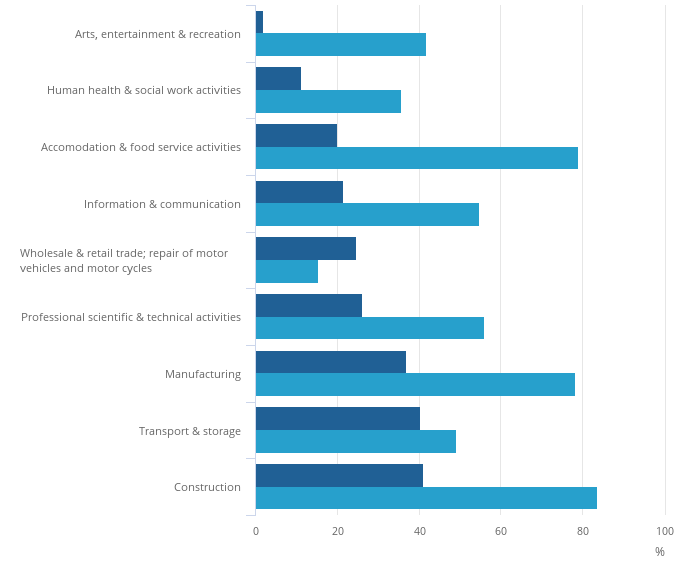
- This is the third consecutive month vacancies have surpassed a million. See bar chart 2 for a breakdown by industry.
Bar chart 2 – Vacancies by sector. The dark blue bar shows the change on the quarter (dark blue bar) and the light blue bar shows the change since March 2020. Source: Office for National Statistics – Vacancy Survey.
Economically inactive
The economic inactivity rate stands at 21.1%, unchanged on the previous quarter and 0.9 ppts higher than before the pandemic.
- 8.7 million people are economically inactive, down 6,000 on the quarter but up 365,000 since March 2020.
- 27% of those economically inactive are students, 30% are long-term sick, and 0.4% are ‘discouraged workers’ (those that believe there are no jobs).
- The number of economically inactive people who stated that they wanted a job increased in the early stages of the pandemic but has fallen since to a record low for the second month in a row.
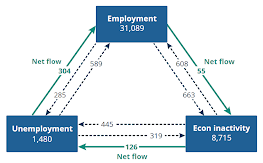
Figure 1 – The flow of people between employment, unemployment and economic inactivity (in thousands). Source: Office for National Statistics – Labour Force Survey.
Our Commentary
When we look at the labour market for all age groups, signs that the labour market is recovering continue. There was a record high net flow of 304,000 from unemployment to employment (see figure 1) – this is the strongest aspect of the recovery and suggests we have faced the worst of the unemployment crisis for now. However this comes with some small print – there are a record number of vacancies but also less people in the labour market than pre-pandemic, meaning the labour market is tighter than it has been in recent years. We know Brexit and the pandemic is driving the size of the labour market down, but we also have changing worker attitudes and potential skills shortages too.
For young people, the labour market looks promising. The employment rate is up, driven by young people in part time work and zero-hour work, which is generally the employment young people in education find themselves in. Economic inactivity is still up on pre-pandemic levels, largely driven by more young people choosing to participate in education. Headline unemployment figures show youth unemployment is at pre-pandemic levels, however within this, those unemployed for 12 months is still above pre-pandemic levels and these young people will be at risk of the scarring effects long-term unemployment has.
As we continue to recover, we must encourage the Government to remember the job is not done for young people – we need to ensure that young people are entering quality opportunities with decent pay, skills development, progression and work-life balance. The key findings from the Youth Voice Census 2021 speaks to this months ONS data release:
- Rising mental health concerns for young people – ONS data found rising long-term illness in economic inactivity data for all ages.
- Young people are struggling to access quality work – ONS data shows young people are choosing education rather than entering a turbulent labour market.
- Young people are concerned about catching up – 160,000 more young people are economically inactive and will be furthest away from ‘catch up support’.
- No Space For Young People – with a rising number of young people in employment and participating in education we need to ensure all are supported with spaces and devices to do their school work and work from home if hybrid working continues.


