The ONS have released the latest Labour Market Overview covering the months February 2021 – April 2021, there is additional data that covers May.
What Does This Mean For Youth Employment?
Headlines for young people
This data explores what this looks like for young people (16-24 years old).
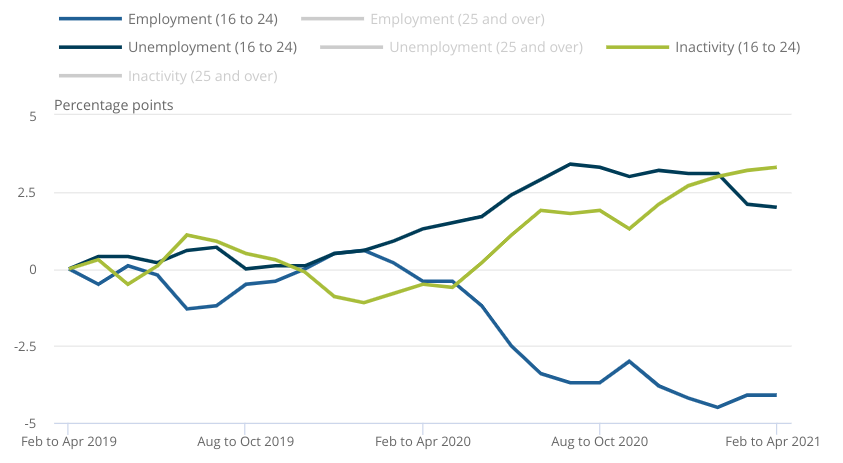
Graph 2 below gives an overview of changes to the employment, unemployment and economic inactivity rate since June 2019.
In work:
- There are 3,481,309 in employment, a slight increase of 6,859 on the quarter, but down on the previous year (by 273,517).
- The employment rate is 50.9%, up 0.1 percentage points (ppts) on the previous quarter, but again is still down on the previous year by 3.7 ppts.
Unemployment
- 529,211 are unemployed; down 52,480 on the previous quarter and down 5,430 on the previous year.
- The unemployment rate is 13.2%, down 1.1 ppt on the previous quarter, up 0.7 ppts on the previous year.
- The claimant count in May 2021 stands at 477,869; this is a decrease of 22,418 since April 2021 (-4.5%) and a decrease of 29,268 on the year (-5.8%).
- However the claimant count is still up 103.3% since March 2020.
Economically inactive
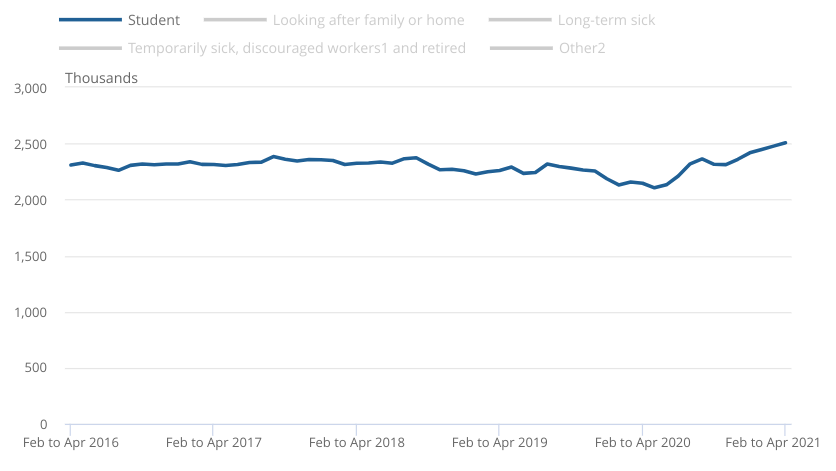
- There are 2,826,105 young people currently economically inactive; up 36,557 on the previous quarter, up 241,010 on the year. A large proportion are in education (see graph 1 below), though this figure is for all age groups.
- The economic inactivity rate is 41.1%; up 1.7 ppts on previous quarter and 4.1 ppt on the previous year.
- PAYE data shows that there was a decrease of 126,000 of payrolled employees aged younger than 25 years between May 2020 and May 2021.
- Estimates for young people not in employment, full-time education, and training (NEET) have also fallen by around 90,000.
Graph 1 – Economic inactivity reason given as ‘Student’. Source: Office For National Statistics – Labour Force Survey
Graph 2 – Employment, unemployment and economic inactivity rates for young people. Source: Office for National Statistics – Labour Force Survey
Headlines for all ages
In work
- The employment rate is 75.2%; this is down 0.2 ppts on the previous quarter and down 1.4 ppts since December 2019 to February 2020.
- PAYE data shows the number of payrolled employees rose 197,000 in May 2021, the sixth consecutive month of growth. This is also up by 0.5% compared with May 2020.
- However, the number of payrolled employees is down by 1.9% since February 2020, a fall of 553,000.
- The total number of weekly hours worked was 975.3 million; this is up 7.2 million hours on the quarter and down 77 million hours on the year.
- The redundancy rate decreased by a record 7.1 per thousand employees on the quarter to 4.0 per thousand employees, similar to pre-pandemic levels. The redundancy rate peaked in September to November 2020 at 14.2 per thousand.
Unemployment
- The unemployment rate is 4.7%; 0.3 ppts lower than the previous quarter but still up 0.8 ppts higher on the year.
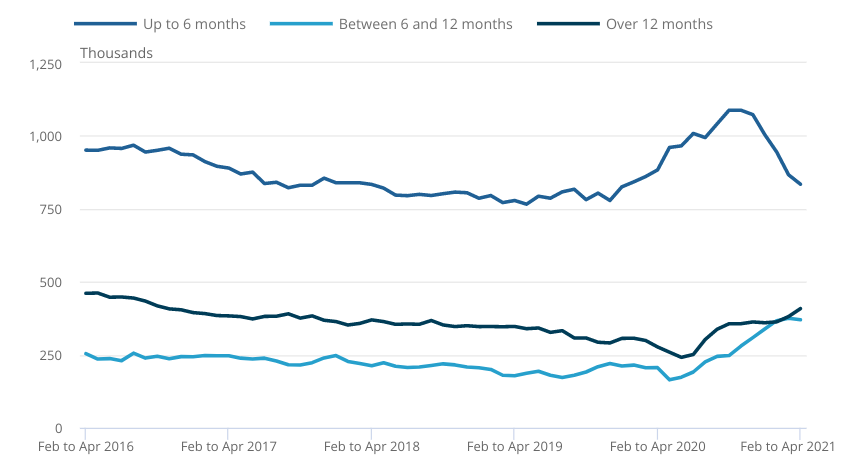
- Whilst short-term unemployment continues to fall, we see long-term unemployment creeping up. Over 12 months spent unemployed is beginning to rising at a faster rate compared to 6-12 months (see Graph 3).
- The claimant count stands at 2,494,676; this is down 3.6% on the month and 5.8% on the year. This is still up roughly 100% since March 2020.
- There were 758,000 vacancies between March May 2021 with a growth of 24%. This is now only 27,000 below pre-pandemic levels.
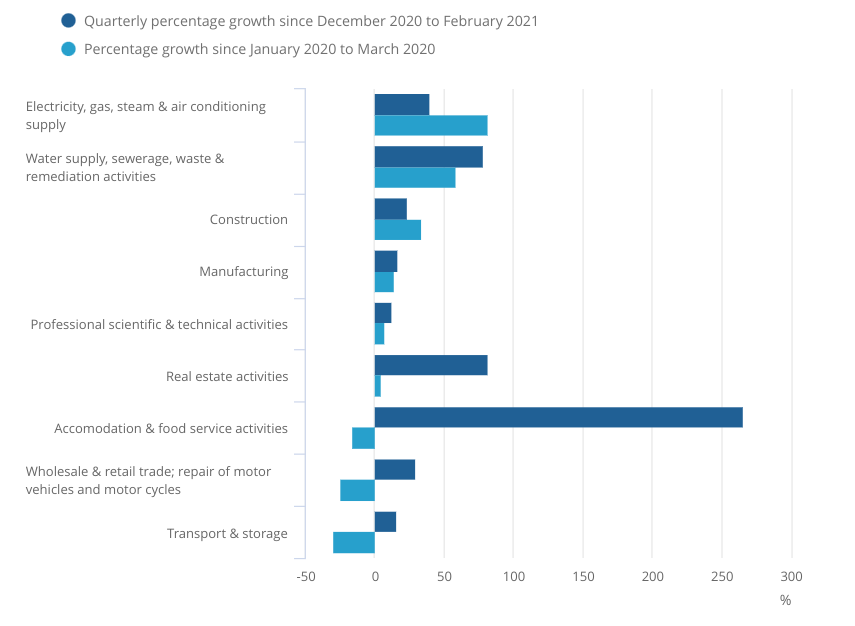
- Accommodation and food services had the strongest recovery, with transport and storage showing the weakest recovery. Professional scientific and technical activities showing the weakest growth (see Graph 4).
 Graph 3 – Length of time spent unemployed. Source: Office for National Statistics – Labour Force Survey
Graph 4 – Vacancies by sector; contraction and recovery or growth since May 2020. Source: Office For National Statistics – Labour Force Survey
Economically inactive
- The economic inactivity rate was largely unchanged on the previous quarter at 21.0%.
- Since 1971 the economic inactivity rate has been gradually falling and began to rise again during the pandemic.
- The rises in economic inactivity can mainly be attributed to those staying or choosing education over finding employment.
Our Commentary
The latest figures are a positive sign that the UK’s labour market is starting to recover after 18 months of lockdown measures, reduced working hours and uncertainty for business. However, this is acutely different amongst age groups and gender; the data shows that young people have not seen the same levels of recovery as all ages. Long term unemployment continues to rise for all ages (graph 3), despite the unemployment rate falling.
A word of caution, yearly comparisons of data for young people are still useful but only capture data now from the time we have spent in the pandemic. This means the comparisons give us a snapshot of changes during the pandemic, but do not give us context of the data before social distancing measures took hold in March 2020 and when we first started to see the impacts of Covid-19 on the labour market.
We see that redundancies have fallen by a record on the year and strongly recovered compared to the record high in January 2021 to roughly to pre pandemic levels. Alongside this we see vacancies have risen again to just above pre-pandemic levels, with the sectors impacted the most recovering well this quarter; accommodation and food services sector vacancies have increased by 266%.
The easing of lockdown measures has largely driven these figures, with Covid-19 safe practices, such as table service only in pubs, requiring more staff. Should this continue, hiring in this sector could begin to make up ground on having fared for the largest falls in payrolled employment.
There are undercurrents that we should be concerned about. PAYE data shows that we continue to see young people aged under 25 years, women and people living in London, alongside part-time and low paid workers and the self-employed, bearing the brunt of reduced hours, being temporarily away from work (furlough) and job losses. Self-employment has also continued to fall.
Young people are still hugely impacted; they have told us that the pandemic has allowed them to build crucial skills such as communication, but has made gaining work experience near impossible. They have struggled to gain access to the face-to-face learning and careers advice they need and are still facing barriers to employment in rising living costs, high expectations around experience and qualifications from employers and mental health challenges.
We must see a joined up approach from the Government, and a firm commitment to an opportunity guarantee meeting the needs of young people and guiding them through this difficult time in their education to employment transition.


