The latest ONS data shows the employment rate at 75.1%, lower than for May to July 2017 (75.3%) but higher than for a year earlier (74.4%).The data available covers the periodbetween August 2017 to October 2017.
Estimates from the Labour Force Survey show that, between May to July 2017 and August to October 2017, the number of people in work fell, the number of unemployed people also fell, and the number of people aged from 16 to 64 not working and not seeking or available to work (economically inactive) increased.
We take a look at the headlines and the youth unemployment figures in more detail:
- There were 32.08 million people in work, 56,000 fewer than for May to July 2017 but 325,000 more than for a year earlier.
- The employment rate (the proportion of people aged from 16 to 64 who were in work) was 75.1%, lower than for May to July 2017 (75.3%) but higher than for a year earlier (74.4%).
- There were 1.43 million unemployed people (people not in work but seeking and available to work), 26,000 fewer than for May to July 2017 and 182,000 fewer than for a year earlier.
- The unemployment rate (the proportion of those in work plus those unemployed, that were unemployed) was 4.3%, down from 4.8% for a year earlier and the joint lowest since 1975.
- There were 8.86 million people aged from 16 to 64 who were economically inactive (not working and not seeking or available to work), 115,000 more than for May to July 2017 but 56,000 fewer than for a year earlier.
- The inactivity rate (the proportion of people aged from 16 to 64 who were economically inactive) was 21.5%, higher than for May to July 2017 (21.2%) but lower than for a year earlier (21.7%).
YOUTH EMPLOYMENT FIGURES
Within this data set young people are defined as those aged 16 – 24. Young people in full-time education are included in the employment estimates if they have a part-time job and are included in the unemployment estimates if they are.
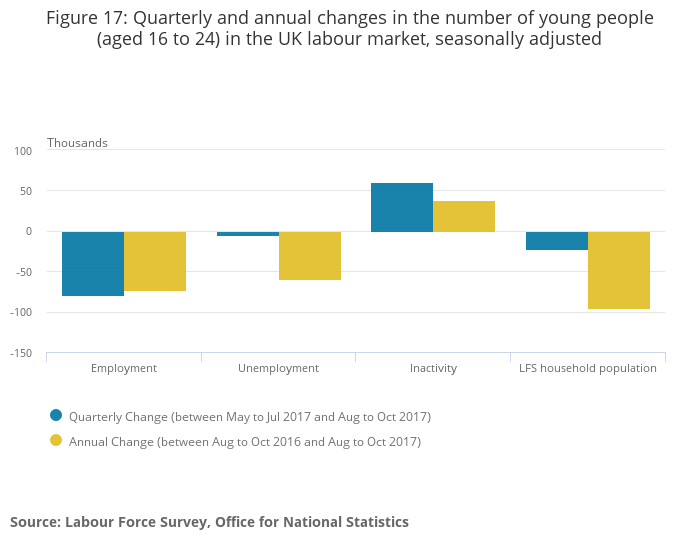
For August to October 2017, for people aged from 16 to 24, there were:
- 3.84 million people in work (including 853,000 full-time students with part-time jobs)
- 523,000 unemployed people (including 186,000 full-time students looking for part-time work)
- 2.72 million economically inactive people, most of whom (2.09 million) were full-time students
For August to October 2017, the unemployment rate for 16- to 24-year-olds was 12.0%, lower than for a year earlier (13.0%).
The unemployment rate for those aged from 16 to 24 has been consistently higher than that for older age groups. Since comparable records began in 1992:
- the lowest youth unemployment rate was 11.6% for March to May 2001
- the highest youth unemployment rate was 22.5% for late 2011
WHAT DOES THIS MEAN FOR YOUNG PEOPLE:
The unemployment rate for 16 to 24 year olds has seen little movement in the last year and still remains disproportionately higher than any other group of people.
Youth unemployment is showing a quarterly fall. There are still 524,000 unemployed young people, and 343,000 (4.8% of the youth population) who are unemployed and not in full-time education.
The proportion of unemployed young people (not counting students) who are not claiming Jobseeker’s Allowance and therefore are not receiving official help with job search is now 52%.
We appreciate the challenges that come with recording and reporting the data and some of the hidden figures and numbers of young people that go unrecorded in figures. The recent Youth Jobs Index from Impetus PEF raises many concerns you can read the full report here.


