A-level results in England were released today, and students were graded on exams they did not sit after months of disrupted learning.
Although on the surface results have improved this year, with a record high for A*/A grades and an overall rise of 2% in achievement, it is not the same story for everyone. The story on the national level is very different from that at the individual school and pupil level, and students with multiple barriers to their learning are most likely to be affected. Here is the full Ofqual report on awarding qualifications this summer.
Results were calculated using Centre Assessment Grades (CAGs) – the teacher’s professional judgment of the most likely grade students would of achieved had exams gone ahead with teaching and learning continuing as normal. The grades were based on records of student performance -mock exams, non-exam assessments, homework assignments and other forms of performance.
Students were then placed into ranking orders for each for each grade within every subject, 1 being the most secure within that grade through to least secure within the grade. This would then have to be signed off by two teachers, the head of year and the principle. Results were then standardised using an algorithm that takes into consideration both school and pupil past performance, alongside national level grade distributions.
Key Statistics: comparing attainment to 2019
- In England, 36% of entries had a lower grade than teachers predicted, 3% were down two grades.
- Independent schools saw the greatest improvement on A*/A grades last year, rising by 4.7%.
- However academies (1.7%), comprehensives (2%) and colleges (0.3%) saw much lower rises in A*/A grade achievement.
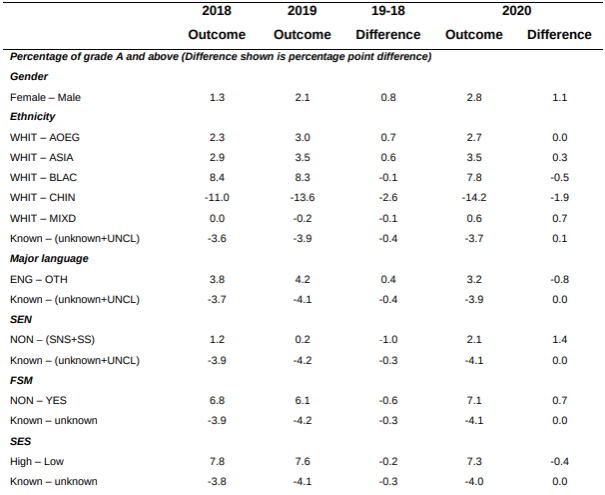
- There is a very small drop in the percentage of students with Special Educational Needs achieving grade A but not grade C.
- Those on Free School Meals receiving A*/A dropped by 0.1% and those attaining C or above rose by 1%.
- Those from Low-Income Households receiving A*/A grades rose by 1% and those attaining C or above rose 2%. Those in Medium-Income and High-Income Households rose between 0.7% and 1% across both A*/A and C and above.
- The table below displays A-level attainment outcomes in 2018, 2019 and 2020 alongside the difference between 2018/19 and 2019/20. It has further been broken down into factors that could impact attainment:
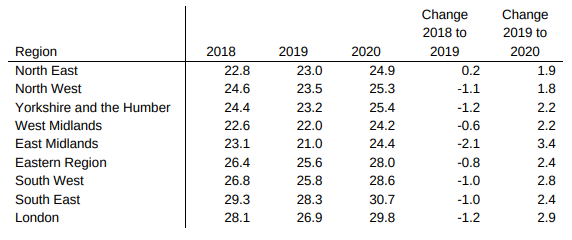
- Regional attainment differences can be seen in the table below:
Our View
We would like to congratulate those students who received the grades they wanted and have secured their place in higher education or other forms of training and employment. Yet on a day when results overall were up 2% it was an unfair and sad day for 40% of students who saw their grades move downwards.
Whilst we appreciate the algorithm used in standardising any generous or harsh marking pulls the national attainment distribution in line with previous years, it will have such a huge role to play this year as exams have not been taken and has the potential to exacerbate existing problems within the marking system.
It seems if you live in the north; are male; White-Chinese; receive free school meals; have any form of learning difficulties or requirements (SEN/SES); or attend a institution in a disadvantaged area, you are most likely to have your grades reduced. There is still further analysis to be done around the data and who has been affected the most by this years system.
If we see that disadvantaged pupils have been disproportionately affected as more data comes to light we must see swift and decisive action from the government to address that balance. It is simply unacceptable that students who have worked so hard these last two years have their next steps and that hard work undermined by an algorithm.
“I am reassured to see the Secretary of State call on Colleges, Universities and employers to commit to the offers in place or allow for the appeals process to go through, this situation will be causing huge concern and anxiety for so many young people and it is simply not fair.
Our young people have every right to feel let down by the system if they have been a victim of the marking down.
It is on us all now to ensure that no one is left behind because of this years results and that our young people see a UK commitment to ensuring they can all move on to good quality education, employment or training destinations.
We have a lot of advice and guidance on our website and will be available to support young people at this time.” Laura-Jane Rawlings, CEO, Youth Employment UK.


